Software Development
DORA Metrics: Practical Implementation Guide

How do you calculate performance in software engineering? Some teams use lines of code or story points as evaluation metrics, but they only tell half of the story. A group of programmers can produce hundreds of lines of code, but that in itself does not tell us the impact of that output.
This is the challenge technology leaders face: how do we foster high performance if we cannot accurately measure it?
The DORA metrics framework provides a proven solution. Established by Google’s DevOps Research and Assessment (DORA) group, this set of five key metrics (recently updated from four) offers a holistic view of the software delivery life cycle by balancing speed with stability.
This guide offers a practical look at implementing these metrics to drive meaningful and sustainable improvement. It explains what DORA metrics are, presents a structured plan for and identifies several typical challenges when adopting them. In this way, team leaders can have a clearer idea of what to expect and how to minimize friction during implementation.
The Five Core DORA Metrics
The power of DORA metrics is their interconnectedness. They function as a system to ensure that improvements in speed do not come at the expense of quality.
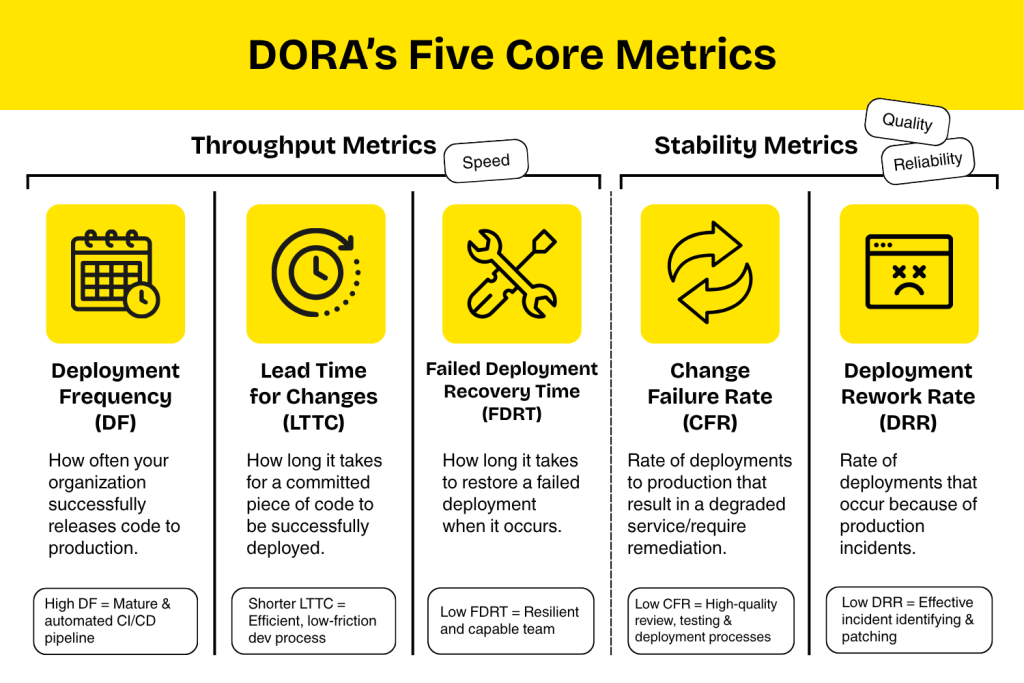
Throughput Metrics (Speed):
- Deployment Frequency (DF): How often does your organization successfully release code to production? A high frequency indicates a mature and automated CI/CD pipeline.
- Lead Time for Changes (LTTC): How long does it take for a committed piece of code to be successfully deployed? A shorter lead time reflects an efficient, low-friction development process.
- Failed Deployment Recovery Time (FDRT): Previously known as Mean Time To Recovery (MTTR). When a failed deployment occurs, how long does it take to restore? A low recovery time is a critical indicator of a team’s resilience and incident response capabilities.
Stability Metrics (Quality & Reliability):
- Change Failure Rate (CFR): What percentage of deployments to production result in a degraded service or require remediation (e.g., a hotfix)? A low CFR signifies high-quality review, testing, and deployment processes.
- Deployment Rework Rate (DRR): What percentage of deployments occur because of production incidents (also known as rework), requiring reactive fixes? A low rework rate signals the team’s ability to effectively identify and patch incidents before shipping.
A Practical Framework for Implementation
When adopting DORA metrics, teams commit to a strategic assessment that involves automating data collection, centralizing signals, and creating a feedback-driven culture. Put simply, implementation does not begin and end with simple measurement.
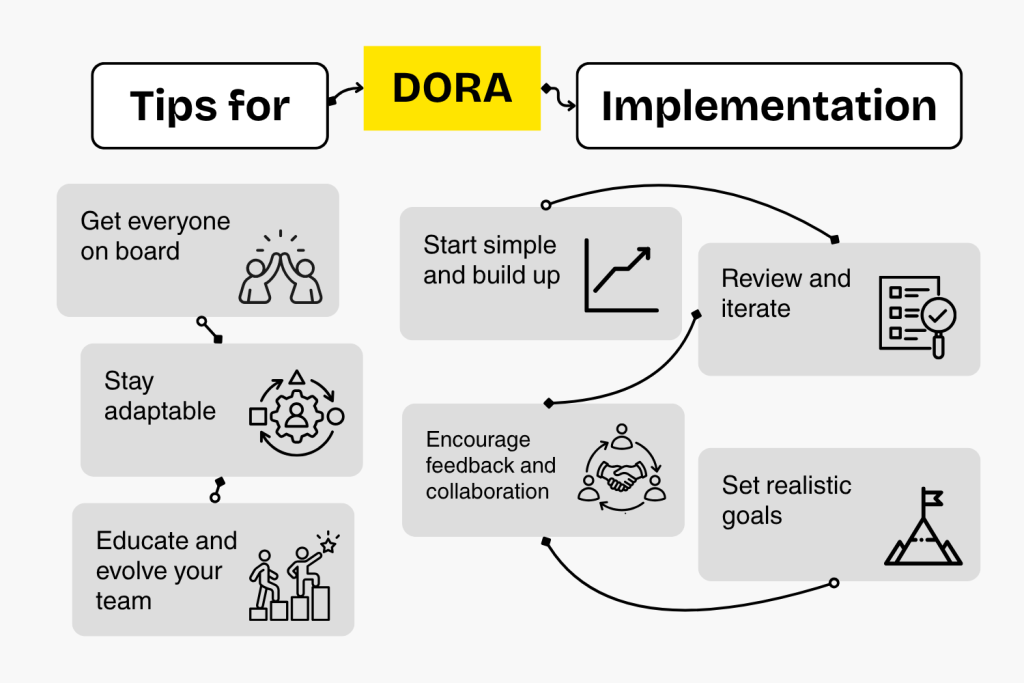
1. Automate Data Collection from Signal Sources Accurate and real-time data is the foundation of a successful DORA implementation. The first step is to identify where the key signals originate in your existing toolchain and automate their collection.
- Source Control (e.g., GitHub, GitLab): This is the source for commits, merges, and pull requests, which are essential for calculating LTC.
- CI/CD Pipelines (e.g., Jenkins, CircleCI): These tools provide data on deployment events, test failures, and rollbacks, which are necessary for measuring DF and CFR.
- Incident Tracking & Observability (e.g., PagerDuty, Datadog): These systems are the source of truth for calculating FDTR, as they log incident start times, resolutions, and overall service status.
2. Aggregate and Calculate Metrics Once signals are collected, they must be centralized and processed.
- Data Centralization: Consolidate event data from your various tools into a central platform, such as a data warehouse (e.g., BigQuery) or a log aggregation system (e.g., Elasticsearch).
- Automated Calculation: Implement automated jobs or scripts to process this raw data daily. This ensures that your metrics, such as DF (Number of Deployments / Time Period) and CFR (Failed Deployments / Total Deployments), are calculated consistently using standardized logic.
3. Visualize Performance and Establish Feedback Loops Raw metrics are not useful without context. The data needs to be translated into actionable insights for teams.
- Dashboards: Use visualization tools (e.g., Grafana, Tableau) to build dashboards that track metric trends over time. This allows teams to see the impact of process changes and identify long-term patterns.
- Contextual Views: Do not just display top-level numbers, but provide drill-down capabilities that link a change in a metric (e.g., a spike in CFR) back to the specific commits, deployments, or incidents that caused it.
- Collaborative Reviews: Integrate these dashboards into team retrospectives and planning sessions. Use the data as an objective starting point for conversations about what is working and where bottlenecks exist.
4. Foster a Culture of Blameless Improvement The final, and most critical, step is cultural. The success of DORA metrics depends on how they are used.
- System, Not Individual: Data collected by DORA metrics evaluate issues or outcomes at the level of systems and processes. Accordingly, these metrics should not be used to reward or punish individuals. A high CFR, for example, signals a process problem.
- Improvement-Focused: Instead of “hitting a number,” the goal should be to use the numbers to drive continuous improvement. Frame discussions around solving problems collaboratively.
- Leadership Buy-In: Leadership must actively take part in championing these metrics as tools for learning and growth, thereby reinforcing the message to the whole team.
Common Pitfalls to Avoid
During the implementation process, organizations may encounter these predictable challenges:
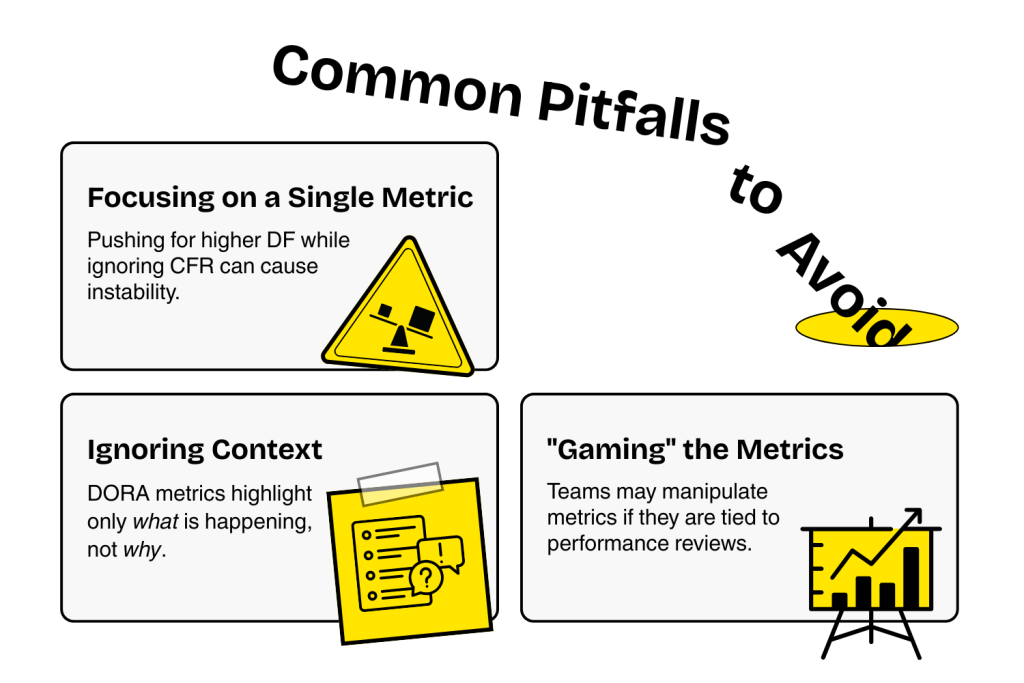
- Focusing on a Single Metric: The five metrics form part of a balanced and interconnected system. Pushing for higher DF without paying attention to the CFR raises the risk of instability.
- Ignoring Context: DORA metrics highlight what is happening but not why. They should be paired with qualitative feedback, like developer sentiment surveys, to provide a complete picture.
- “Gaming” the Metrics: If metrics are tied to performance reviews, teams may be incentivized to manipulate them (e.g., by breaking large features into trivial deployments to increase frequency). This undermines the entire system.
Key Takeaway: From Measurement to Improvement
Implementing DORA metrics is an evolving process from simple measurement to data-driven, continuous improvement. While the principles are universal, the specific tools and processes will be unique to each organization. Beginning with automated data collection, standardizing calculations, and fostering a culture of blameless analysis, technology leaders can use this framework to build more efficient, resilient, and high-performing engineering organizations.
Looking to accelerate your roadmap with a high-performing software team? We don’t just provide developers; we deploy engineering excellence.
Book a consultation session with ekino Vietnam to learn how our dedicated teams leverage DORA metrics to guarantee top-tier delivery velocity and code quality for your projects.